Distinguishing between agglomerates and large particles
Online monitoring of Ni-P/SiC electrolyte solution to reduce the amount of agglomerates in response to changing process parameters, e.g. temperature and pH.

Challenge
Creative Nano offers electroplating services and produces electroplated products. Their electroplating line is specially designed for fabrication of nanocomposite coatings by the pulse current electroplating method.
The team was looking to continuously monitor silicon carbide (SiC) nanoparticles in an electrolyte solution before using them for coatings within electroplating processes.
The challenges are:
- The nanoparticles start to agglomerate during the process, which has an impact on the final coating.
- Continuous monitoring would lead to a better understanding of the agglomeration and dissociation behavior and help optimize the production process.

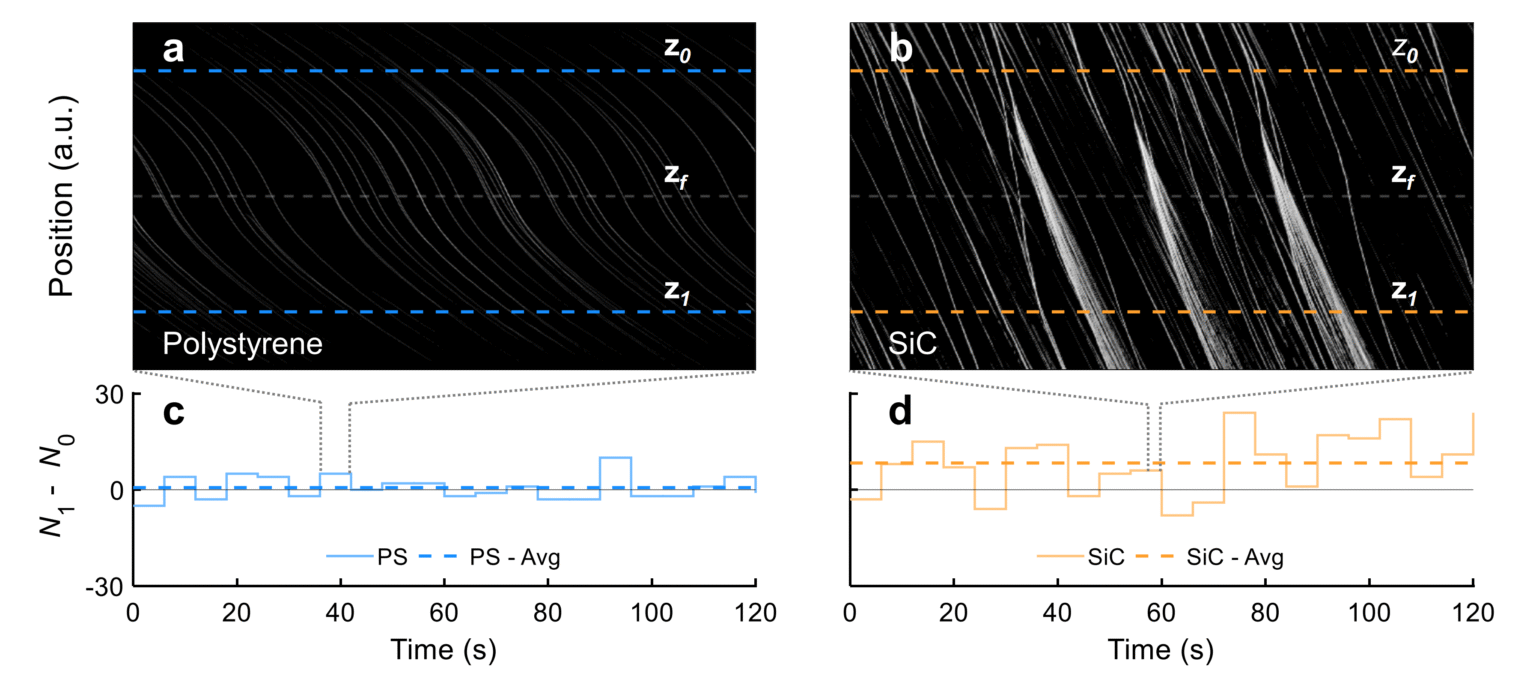
Figure 1: Trajectories of polystyrene nanospheres (a, c) and SiC nanoparticles (b, d), obtained by OF2i®.
Panel (b) shows the dissociation of SiC particle agglomerates as they approach the focal region z f (gray dashed line) of the laser beam. © BRAVE Analytics & Marko Šimić
Application highlights
The figure shows results for the trajectories of particles measured by OF2i®:
(a, c) Polystyrene nanospheres: a typical waterfall diagram of the light scattering of particles
(b, d) SiC nanoparticles showing dissociation of particle agglomerates as they approach the focal region (gray dashed line) of the laser beam. The values are sent to the LIMS every 20 seconds.
- We attribute the dissociation to large optical forces acting on the agglomerates.
- We can estimate the time point of agglomeration dissociation and the number of particles involved in this process.
- If OF2i® splits the particle it was a flocculate, if not, we can assume it is a large particle.

Configuration of the setup:
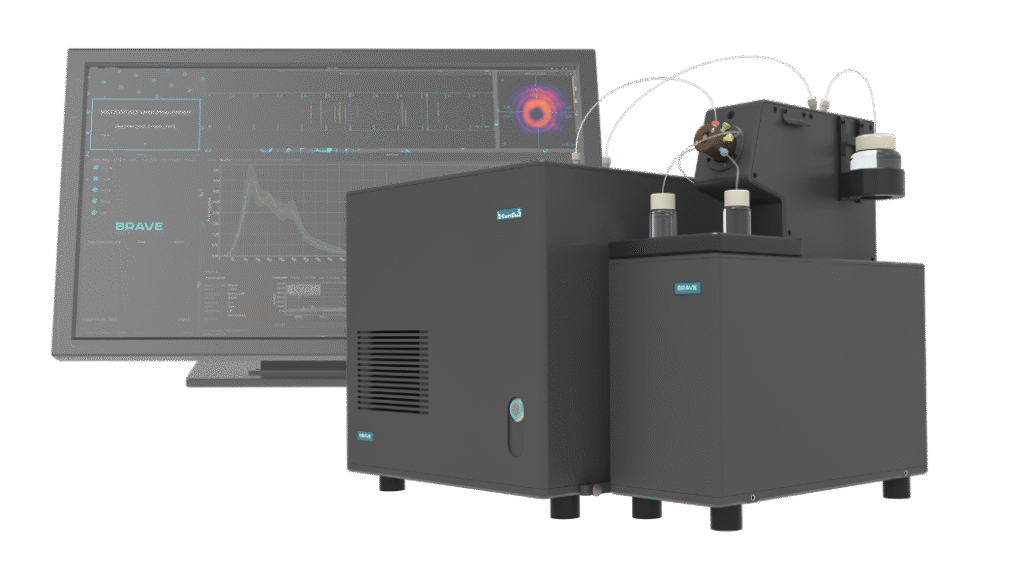
BRAVE B-Curious device for particle sizing with Fluid Automation Module, Control and Evaluation Module and software
The analysis setup used in this case
BRAVE B-Curious determines the particle size distributions of polydisperse systems with single-particle sensitivity.
Delivers automated, continuous and time-resolved results.
Detects ultra-low particle concentrations as well as large-particle tails, LPC, anomalies and outliers.
Is the required base station for all other modules (except BRAVE B-Phat standalone).
Detection range
50 nm* to 3 µm* (*sample-dependent)
Concentration range
optimal: 106 particles/ml to 1010 particles/ml
Particles measured per minute
Up to 1000 particles per minute (sample-dependent)


