Counting and identifying microplastics in surface water after rainfall
Fully automated, high-throughput analysis of standing water, capturing a wide size range of particles and providing detailed number-based spectral classification, including clustering of unknown materials for further investigation.
Proof-of-concept experiment
Surface water after rainfall was used for this proof-of-concept case study. The sample was mixed with a controlled count and size 5 μm polystyrene particles (Applied Microspheres PharmaCounts Traceable Particle Count Control 3M005-25, 3000 ± 300 particles/mL). The mixture was made in a 1:1 ratio, creating a realistic environmental matrix with known microplastic
particles with an estimated 1500 particles per milliliter.
The measurements were performed using the OF2i®-Raman device, BRAVE B-Elementary. First, a measurement was performed with the OF2i® particle sizing method1 to map the overall number-based particle population (count and size, see Figure 1, insert right).
Then, the Raman spectra of the Raman-active populations were recorded in the same device. The Raman spectra were automatically classified and evaluated using the BRAVE proprietary H.A.N.S. software suite.
Both the OF2i® and Raman measurements were performed on the same sample. During the Raman measurement, which took ~50 minutes, a total of 66 Raman-active particles were detected in a total scanned volume of ~4.5 ml.

Figure 1: Detection of polystyrene particles in standing surface water samples, showing further analysis of the 66 detected Raman-active
particles
Data analysis
The Raman-active particles were further categorized in the software according to their spectra and grouped into clusters, see Figure 1, top left. In addition to the spiked polystyrene (Figure 1, insert left), others with partially
weak, partially pronounced Raman and different fluorescence spectra could be distinguished.
A final overview graph of the performed OF2i®-Raman scan is given in Figure 2 which shows the occurrence and temporal distribution of detected particle categories over the 50-minute measurement period, alongside the corresponding average PS Raman spectra, fluorescence signals and other particle signals.

Figure 2: Left: Occurrence and temporal distribution of different particle categories over the full measurement period, illustrating the
specific points in time at which each particle type was detected during the 50-minute scan.
Right: Mean Raman spectra for each particle category. The shaded areas represent the standard error of the mean (SEM), indicating the
variation between individual measurements.
Summary
The combined OF2i®-Raman method enables fully automated and continuous analysis of micro- and nanoplastics. Here, the BRAVE B-Elementary OF2i®-Raman device was used to measure MNPs in complex environmental matrices, including spiked surface water after rainfall with minimal to no sample preparation.
Measurements are taken in-flow, combining OF2i® particle sizing with single-particle Raman identification in the same instrument. A total of 66 Raman-active particles were detected in 4.5 mL of sample within ~50 minutes, with an automatically determined polystyrene concentration of 1172 particles/mL – closely matching the known spiked concentration – demonstrating high recovery rates even in the presence of substantial background particulate matter.
The method delivers fully automated, high-throughput analysis, capturing a wide size range of particles and providing detailed number-based spectral classification, including clustering of unknown materials for further investigation. The system detects plastic particles from 600 nm (limit of detection for polymers), strong Raman scatterers like TiO2 from 250 nm, with an upper limit of detection of 50 μm. Robustness against both organic and inorganic interferences, combined with the elimination of complex
pre-treatment steps, makes OF2i®-Raman a powerful tool for research and routine monitoring.
This OF2i®-Raman approach supports fast, reliable MNP detection in both laboratory, routine analysis and field settings, enabling better data for
environmental and health risk assessments.
References
[1] Optofluidic Force Induction as a Process Analytical Technology –
Šimić et al. (https://doi.org/10.48550/arXiv.2307.05369)
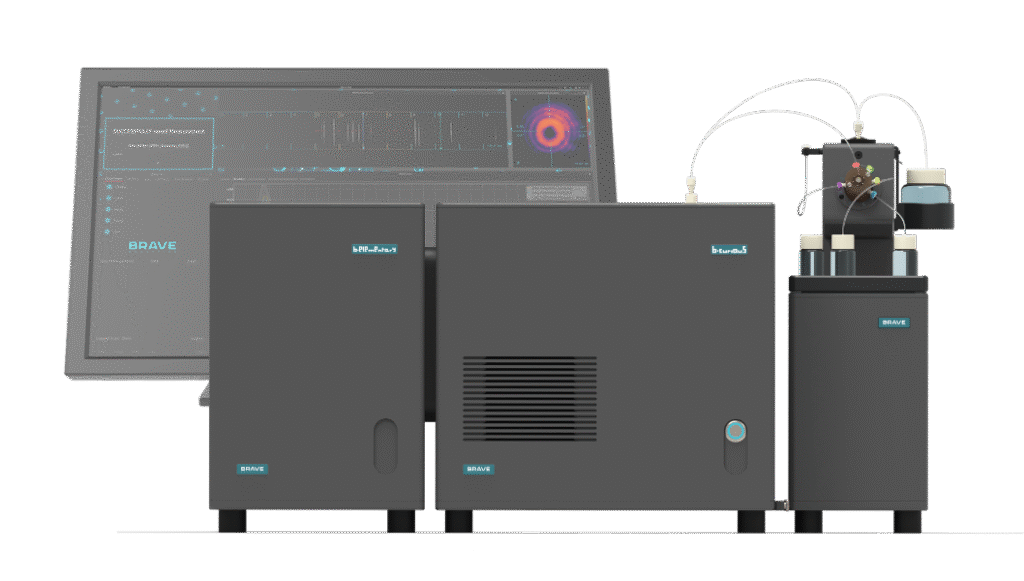
Configuration of the setup:
BRAVE B-Curious with Fluid Automation Module, Control Evaluation Module, software & BRAVE B-Elementary for Raman analysis
The analysis setup used in this case
The BRAVE B-Elementary hardware module is an optional extension for the BRAVE B-Curious base station.
The BRAVE B-Elementary module detects and identifies particles (<1 µm) and microplastics (1 µm to 50 µm) using Raman spectroscopy.
Automated measurement & minimum sample preparation for user-independent results.
Continuous in-flow measurement, ideal for detecting low particle concentrations, even with fluorescent substances.
Detection range
Nanoparticles (<1 µm) and microplastics (1 µm to 50 µm)
Concentration range
Sample-dependent (including ultra-low concentrations)
Particles detected per minute
Approx. 100 particles per minute (sample-dependent)