Evaluating the large particle count (LPC) of fresh and aged CMP slurries from various points of use
A European manufacturer of wafers for semiconductors approached BRAVE Analytics to learn more about their slurries. The company was implementing the same slurry product with different recipes at different points of delivery.
Challenge
Slurries 1 and 2 were mixed, prepared and delivered in an installed pipeline as part of the plant infrastructure. Slurries 3 and 4 were mixed, prepared and delivered in a smaller mobile pipe system. The manufacturing company rated Slurries 1 and 2 (from the installed pipeline) above Slurries 3 and 4 after evaluating the end results of the CMP process. They wanted to find out why the slurries from the installed pipeline performed better than the slurries from the mobile pipeline. As there was frequently a time delay between mixing and use (see Table 1), one hypothesis was that the slurries were degrading over time and this was causing a reduction in the success of the polishing process.
Samples and setup
The four slurry samples were measured by the BRAVE B-Phat large particle detector. This device detects single particles in the size range 2 μm to 80 μm. All samples were diluted 1:2 with MilliQ ultrapure water.
Application highlights
The measurement of the large particles count (LPC value) detected in the 4 samples reveals hardly any difference between the fresh and aged samples from each point of delivery but a marked difference between the slurries removed from the installed pipeline and the slurries removed from the mobile pipeline, see Figure 1.
Slurries 1 and 2 from the installed pipeline had a lower count of large particles per milliliter than Slurries 3 and 4 from the mobile pipeline.
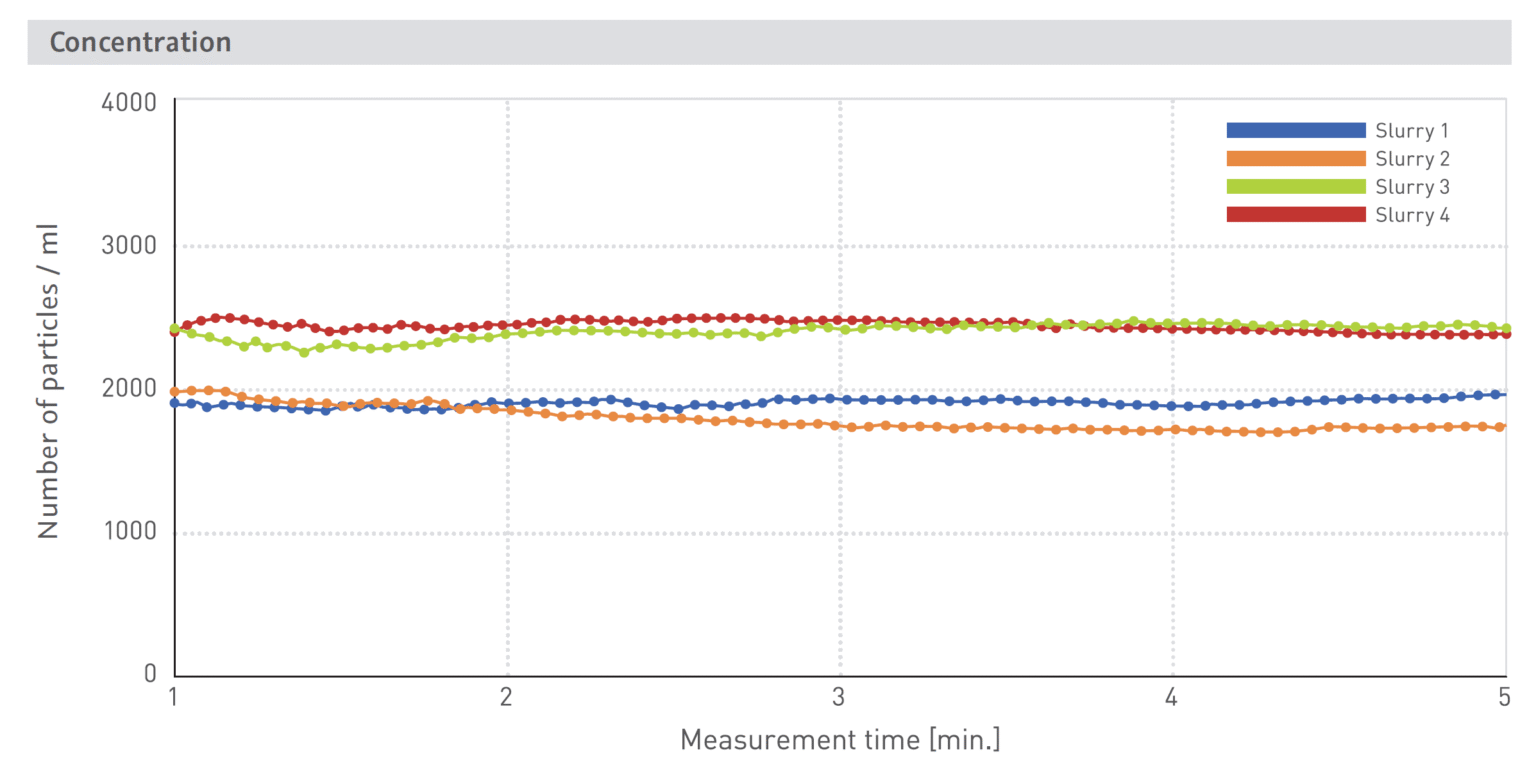
Figure 1: Comparison of Slurries 1, 2, 3 and 4 (for details see Table 1) showing that the large particle count remains stable over time at
approximately 2500 counts per mL for Slurries 3 and 4 and approximately 1800 / 2000 counts per mL for Slurries 1 and 2
Legend:
Slurry 1 (from installed pipeline, fresh sample = blue) and Slurry 2 (from installed pipeline, aged sample = orange); Slurry 3 (from
mobile pipeline, fresh sample = green) and Slurry 4 (from mobile pipeline, aged sample = red)
Table 1: Description of samples
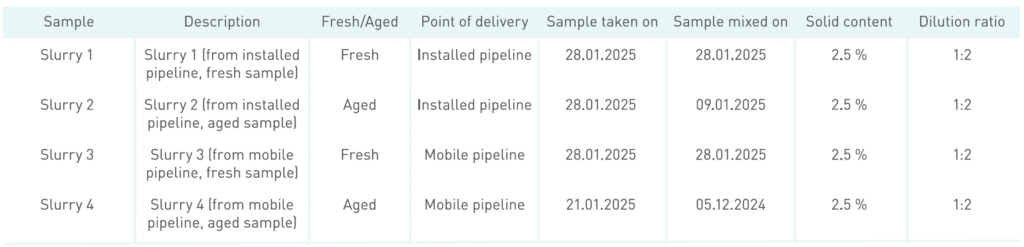
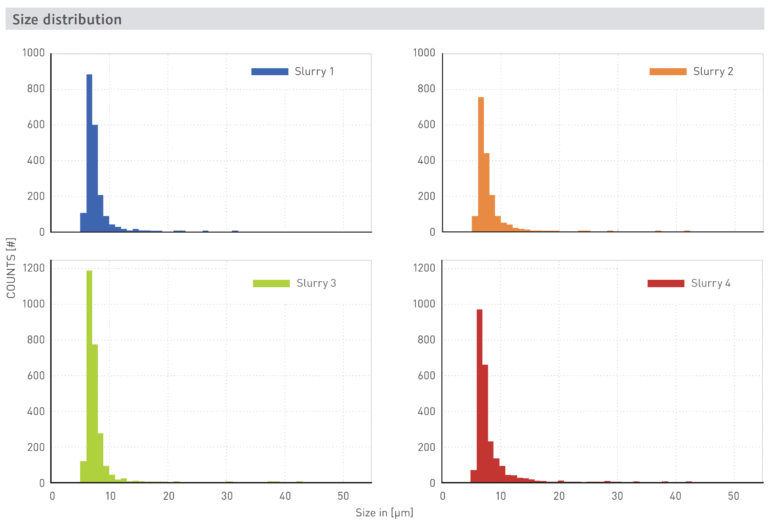
Figure 2: Top: size distribution histogram of measurements on the slurries from the installed pipeline. Slurry 1 (from installed pipeline, fresh sample = blue) and Slurry 2 (from installed pipeline, aged sample = orange) showing a slightly higher number of larger particles found in the aged sample . Bottom: Size distribution histogram of measurements on the slurries from the mobile pipeline. Slurry 3 (from mobile pipeline, fresh sample = green) and Slurry 4 (from mobile pipeline, aged sample = red) showing a very similar number of large particles found in the two samples.
Benefits & Outlook
Four different slurry samples were analyzed using the powerful BRAVE B-Phat large particle detector, which delivered precise concentration data and detailed size histograms. This advanced particle sizing technology provided valuable insights into slurry composition and overall slurry health.
Understanding the particle profile within a slurry enables optimized recipe development. This results in enhanced quality, greater process stability, fewer defects, and a significant boost in wafer yield. In addition, BRAVE B-Phat also enables the assessment of slurry aging and long-term stability, offering a clear picture of the supplied material quality.
In addition, BRAVE B-Phat also enables the assessment of slurry aging and long-term stability, offering a clear picture of the supplied material quality.
This makes it an essential tool for robust incoming material inspection and supplier qualification. With its capability for real-time, online monitoring and evaluation of slurries, BRAVE B-Phat delivers smarter slurry monitoring which opens the door to maximum process control, with minimum product defects.
This makes it an essential tool for robust incoming material inspection and supplier qualification. With its capability for real-time, online monitoring and evaluation of slurries, BRAVE B-Phat delivers smarter slurry monitoring which opens the door to maximum process control, with minimum product defects.
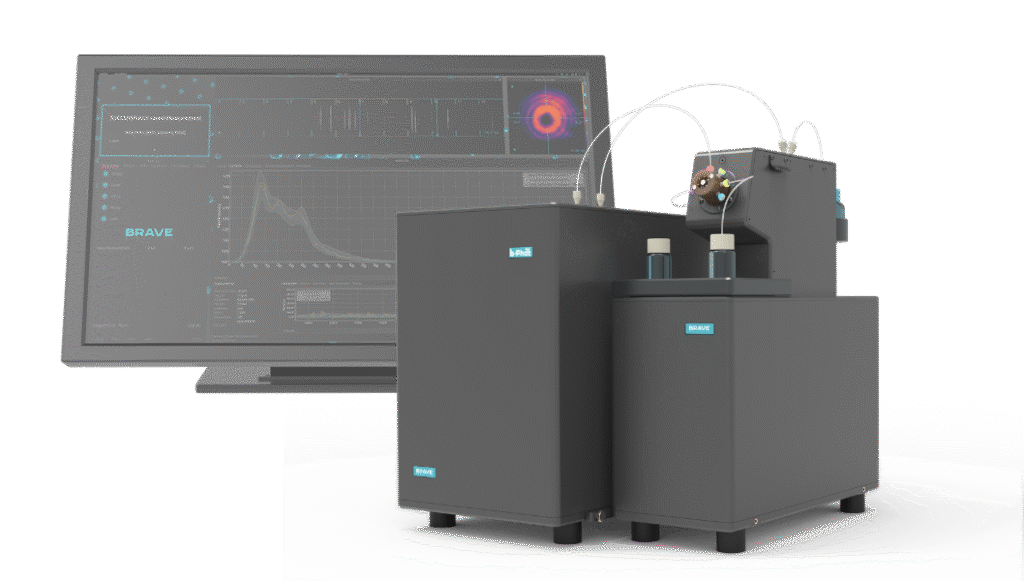
Configuration of the setup:
Standalone BRAVE B-Phat for large particle detection with Fluid Automation Module, Control and Evaluation Module and software
The analysis setup used in this case
The BRAVE B-Phat standalone device detects and sizes large particles based on dynamic imaging / obscuration principles.
Can be used to assess PFAT5 values, detect large aggregates, large-particle tails and anomalies.
Also useful for predictive maintenance.
Detection range
2 µm* to 80 µm* (*sample-dependent)
Concentration range
under evaluation
Particles detected per minute
under evaluation